Descriptive Statistics Case Study
This interactive web application offers a live, story-driven business analytics case study. Designed for undergraduate business analytics students, the simulation contextualizes statistical abstractions into a continuous narrative. The applet builds data empathy, provides an active learning laboratory, and delivers an immediate feedback loop for student analysis.
Pedagogical Objectives & Motivations
- Bridging Theory and Practice: By working with realistic, story-driven scenarios, students gain a clear glimpse into how data science tools and concepts are actually applied to solve complex problems in real-world business settings.
- Developing Structural Data Empathy: Rather than treating data as abstract number grids, the application contextualizes every record within an ongoing business narrative, training students to see the operational realities behind corporate numbers.
- Encouraging Critical Inquiry: The applet moves students past the simple calculation phase (“What formula do I type?”) and pushes them into critical evaluation (“What does this statistical distribution actually imply about our operational capacity?”).
Interactive Student Journey & Curricular Mapping
Phase 1: Data Infrastructure & Classification Mappings
Students are introduced to a master operational spreadsheet tracking transaction records of a coffee shop. Before opening software tools, they must complete an interactive mapping to classify attributes into their appropriate variables types (Categorical vs. Quantitative) and evaluate the collection timeline structure (Cross-Sectional vs. Time Series data). This establishes essential terminology and framework boundaries.
Phase 2: Visual Distributions & Operational Diagnostics
Students transition into Microsoft Excel to run sorting, filtering, and conditional formatting on real transaction lines before building a native Excel frequency distribution histogram. Upon submitting their calculated sample mean and median values to the applet console, they visually discover a heavily right-skewed distribution. The interactive mentor leverages this visual shape to guide students through locating hidden operational bottlenecks.
Phase 3: Dispersion Scales, Position Tracking, and Anomaly Detection
Students dive into metrics of dispersion—calculating sample standard deviations, Interquartile Ranges (IQR), and percentiles to map traffic fluctuations. The applet couples their entries with a dynamic, scalable Standard Normal Curve graphic. As students calculate standardized locations ($z$-scores) for severe operational delays, the visual line marker moves along the bell curve and flashes bright red when crossing past $|z| > 3$, visually isolating true statistical outliers from expected peak rushes.
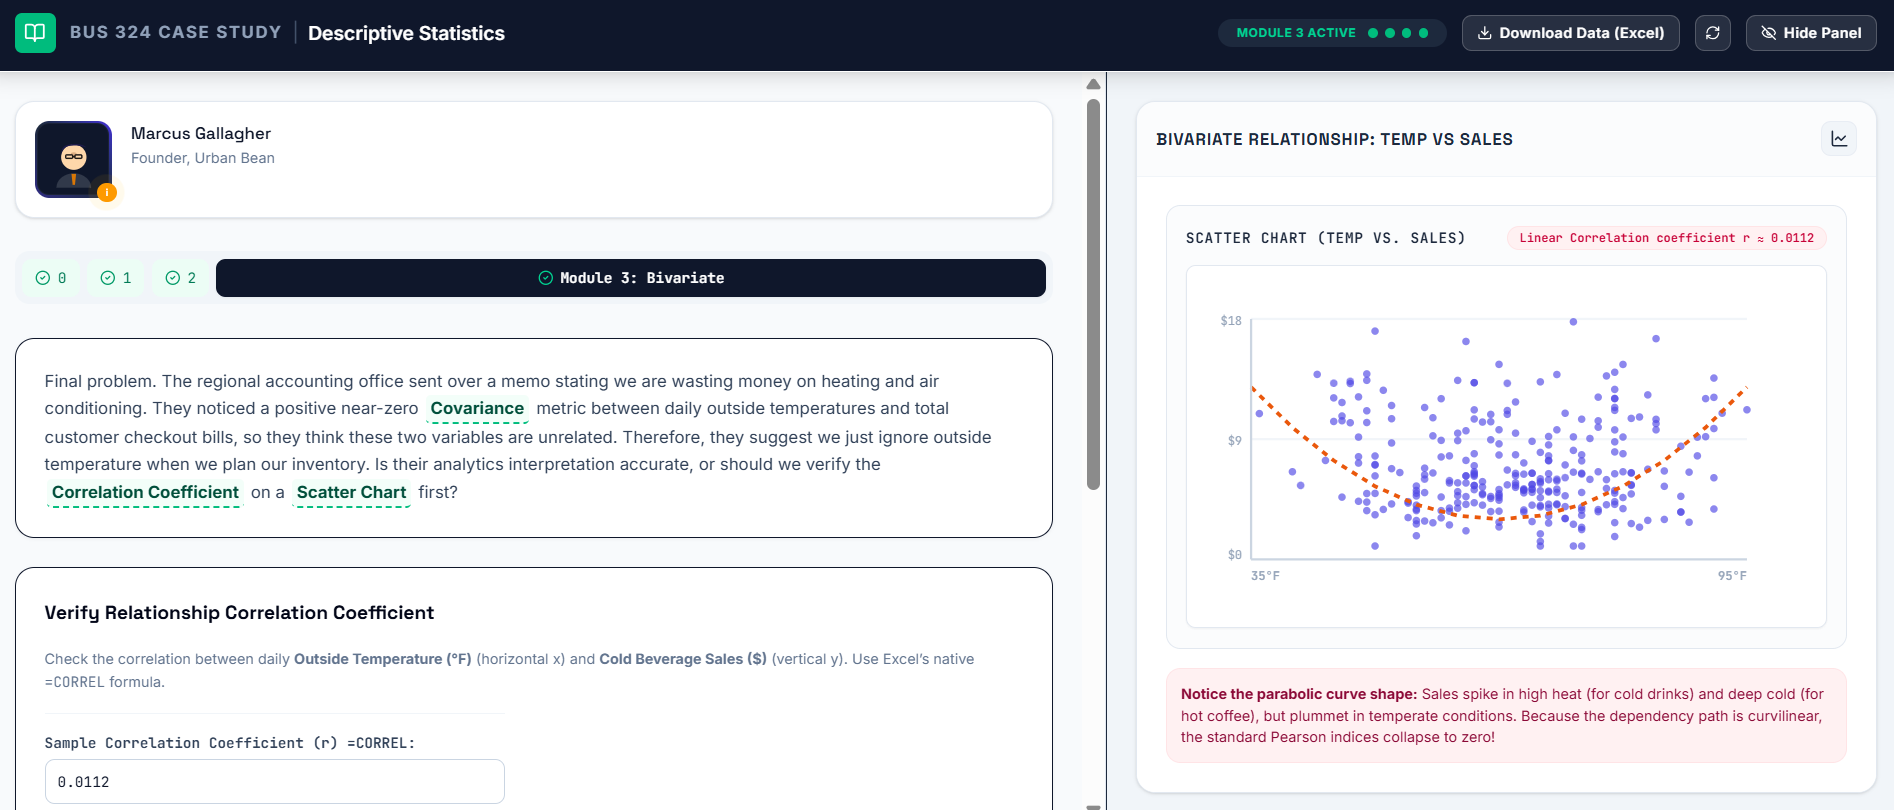
Phase 4: Bivariate Association & The Linear Fallacy
The final module challenges students to evaluate a paradox. While the calculated Pearson correlation coefficient ($r$) sits deceptively near zero (suggesting no relationship), plotting a scatter diagram reveals a clean, geometric U-shaped distribution curve (where transaction revenue spikes during both sub-freezing cold and extreme heat). This provides a memorable “Aha!” moment, permanently teaching students that covariance and correlation evaluate linear relationships only.
Practical Instructor & Content Management Features
- Hyper-Linked Textbook Glossary Tooltips: Key statistical concepts throughout the simulation feature distinct visual indicators. Clicking any underlined term launches a floating definition card showing its description paired with explicit Excel formula keys.
- Inline Text Editing: A secure, discrete instructor verification layer unlocks editing access directly inside the live interface, allowing for real-time text modifications of any dialogue block or label. This allows the instructor to update the narative and save changes to the cloud database conveniently.
- Unified Asset Upload Terminal: Instructors can drag and drop a fresh custom
.csvdataset straight into the administrative dashboard. The system automatically parses the file, updates the student download assets, and recalibrates the underlying verification targets.